

All Respondents' Race/Ethnicity (N=1438)
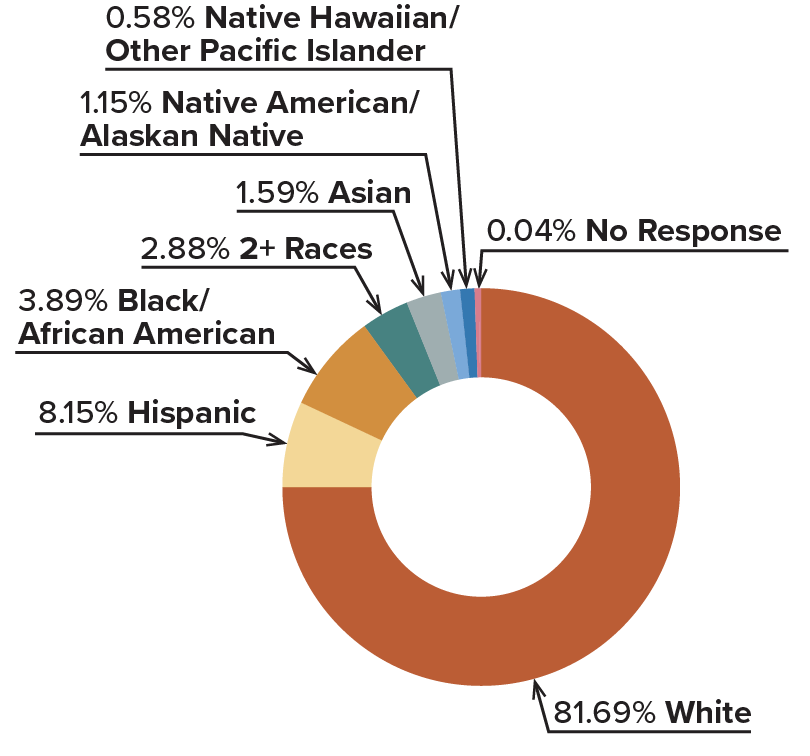
81.69% - White
8.15% - Hispanic
3.89% - Black/African American
2.88% - 2+ Races
1.59% - Asian
1.15% - Native American/Alaskan Native
0.58% - Native Hawaiian/Other Pacific Islander
0.04% - No Response

The majority (81.69%) of respondents who responded identified as White, while
18.24% identified as Hispanic or People of Color.
All Respondents' Race/Ethnicity (N=1438)
| Race/Ethnicity | Percentage |
|---|---|
| White | 81.69% |
| Hispanic | 8.15% |
| Black/African American | 3.89% |
| 2+ Races | 2.88% |
| Asian | 1.59% |
| Native American/Alaskan Native | 1.15% |
| Native Hawaiian/Other Pacific Islander | 0.58% |
| No Response | 0.04% |
The majority (81.69%) of respondents who responded identified as White.
18.24% of respondets who
responded identified as Hispanic or People of Color.
Frequency of Barriers Selected by Parents, Professionals, and Parent-Professionals
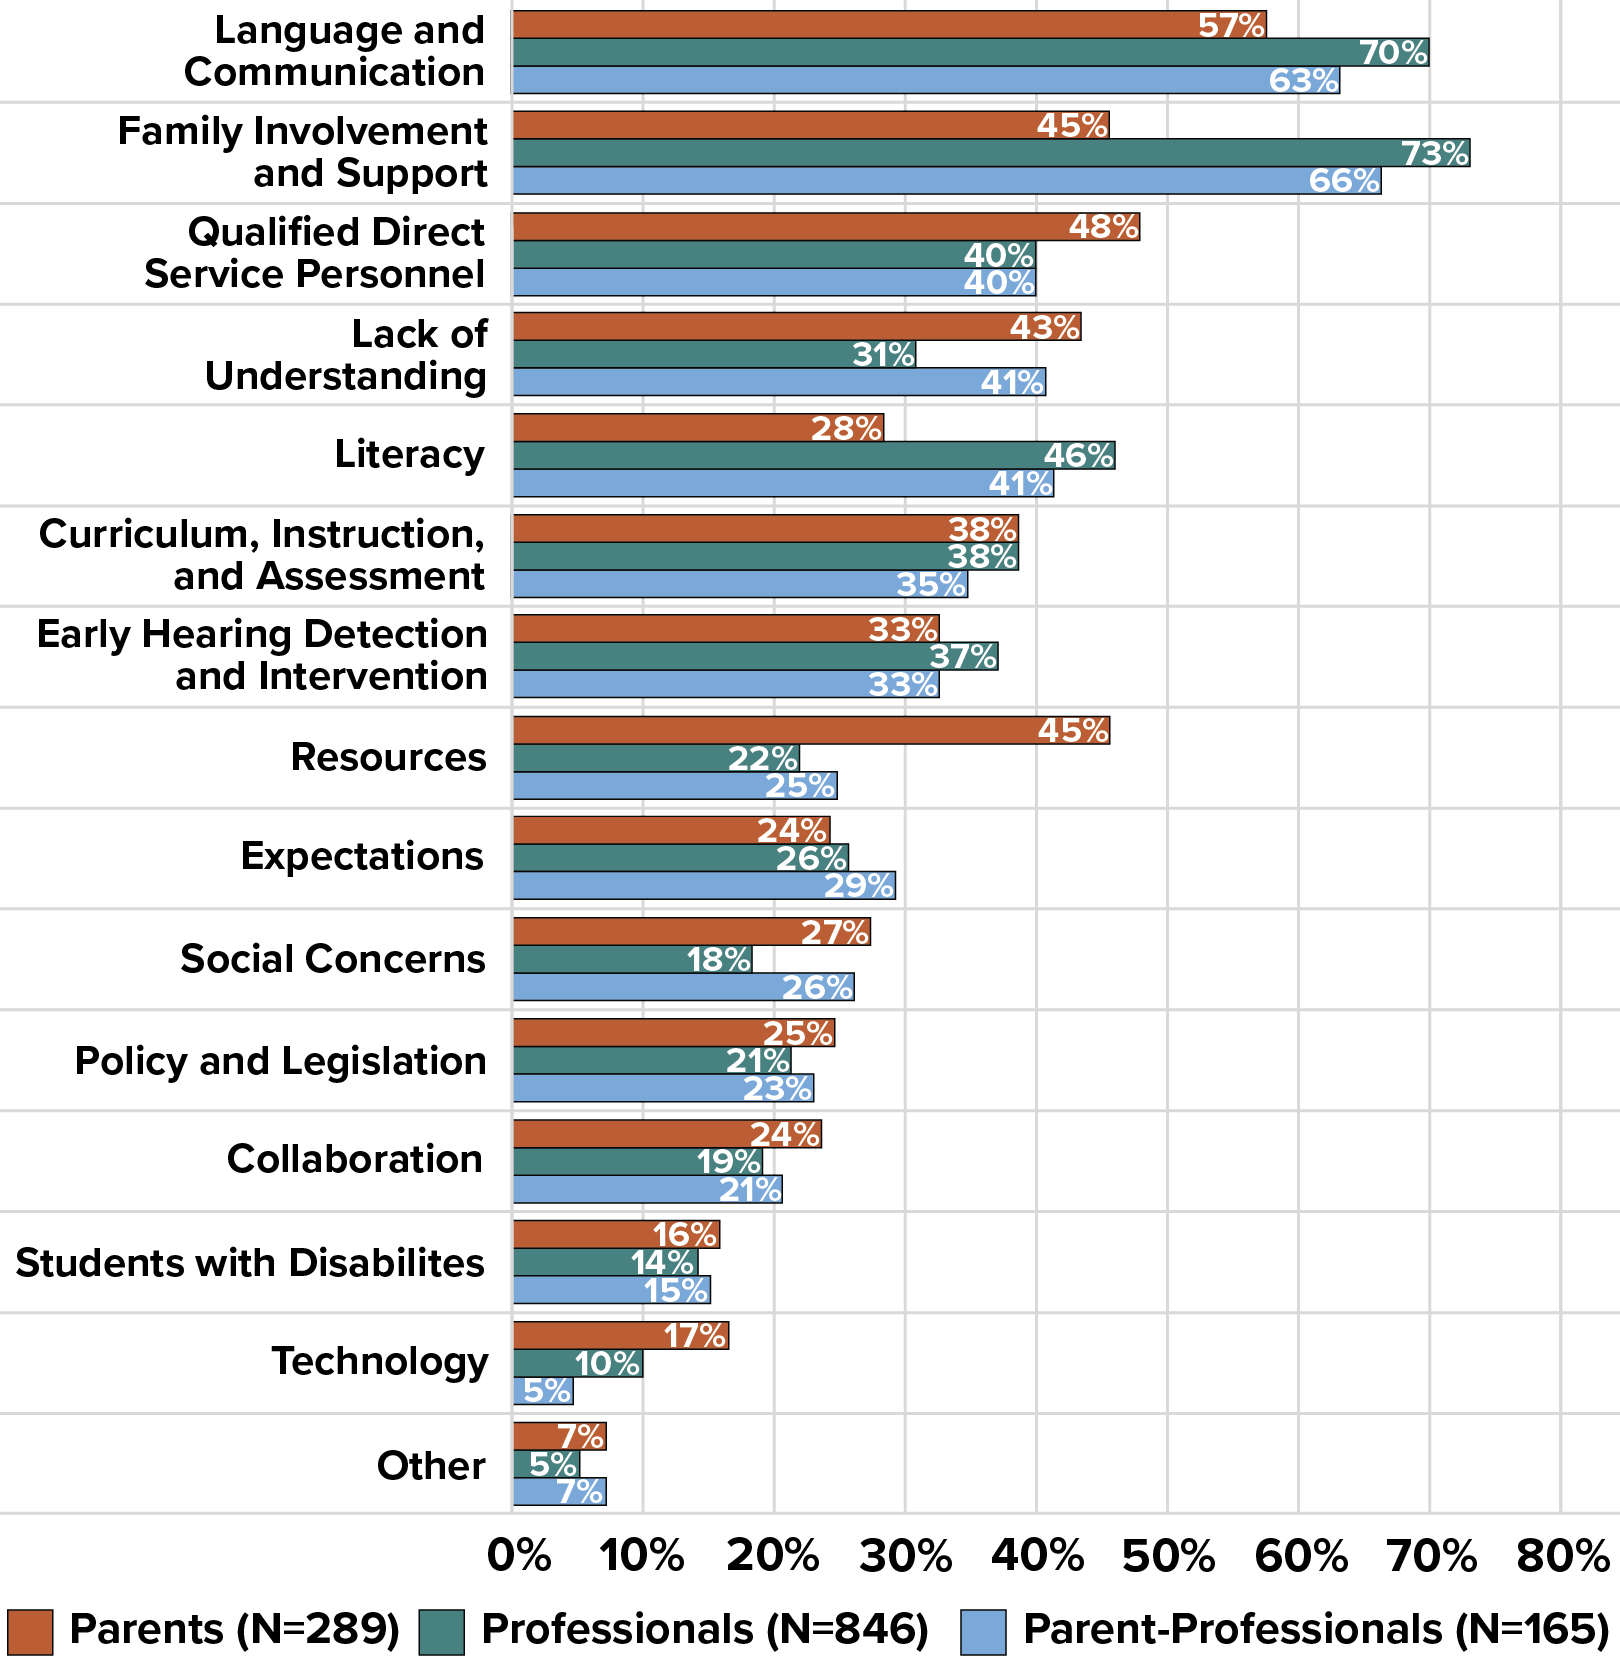
Parents most often chose Language and Communication as the barrier for deaf and hard of hearing students (57%). Professionals and Parent-Professionals most often chose Family Involvement and Support (73% and 66%, respectively).
Frequency of Barriers Selected by Parents, Professionals, and Parent-Professionals
| Barrier | Parents (N=289) | Professionals (N=846) | Parent-Professionals (N=165) |
|---|---|---|---|
| Language and Communication | 57% | 70% | 63% |
| Family Involvement and Support | 45% | 66% | 73% |
| Qualified Direct Service Personnel | 48% | 40% | 40% |
| Lack of Understanding | 43% | 31% | 41% |
| Literacy | 28% | 41% | 46% |
| Curriculum, Instruction, and Assessment | 38% | 38% | 35% |
| Early Hearing Detection and Intervention | 33% | 33% | 37% |
| Resources | 45% | 22% | 25% |
| Expectations | 24% | 26% | 29% |
| Social Concerns | 27% | 18% | 26% |
| Policy and Legislation | 25% | 21% | 23% |
| Collaboration | 24% | 19% | 21% |
| Students with Disabilities | 16% | 14% | 15% |
| Technology | 17% | 10% | 5% |
| Other | 7% | 5% | 1% |
Parents most often chose Language and Communication as the barrier for deaf and hard of hearing students (57%). Professionals and Parent-Professionals most often chose Family Involvement and Support (73% and 66%, respectively).
Barriers by TUG Status for Parents (N=289)
Frequency of Barrier and TUG Selections per Respondent
(Each respondent may belong to multiple TUG categories and report multiple barriers.)
| Barriers and TUGs | Live in Rural Settings N = 63 |
Speak Language Other Than English N = 50 |
Racial/Ethnic Group N = 26 |
Child with Disabilities N = 90 |
Have Deaf or Hard of Hearing Child who is Lower Achieving Academically N = 72 |
Not a Member of TUGs N = 100 |
|
|---|---|---|---|---|---|---|---|
| Collaboration ㅤ |
20% | 24% | 27% | 27% | 20% | 26% | |
| Curriculum, Instruction, and Assessment | 43% | 30% | 47% | 39% | 55% | 38% | |
| Early Hearing Detection and Intervention | 27% | 38% | 24% | 34% | 35% | 33% | |
| Expectations ㅤ |
23% | 28% | 24% | 26% | 28% | 22% | |
| Family Involvement and Support |
47% | 58% | 43% | 50% | 42% | 46% | |
| Lack of Understanding |
43% | 48% | 50% | 48% | 45% | 42% | |
| Language and Communication |
56% | 54% | 43% | 60% | 56% | 7% | |
| Literacy ㅤ |
29% | 22% | 35% | 27% | 35% | 28% | |
| Policy Legislation |
21% | 28% | 39% | 25% | 24% | 26% | |
| Qualified Direct Service Personnel | 58% | 42% | 50% | 49% | 60% | 46% | |
| Resources ㅤ |
54% | 52% | 58% | 50% | 56% | 38% | |
| Social Concerns |
27% | 18% | 24% | 29% | 27% | 28% | |
| Students with Disabilities |
18% | 16% | 16% | 32% | 25% | 6% | |
| Technology ㅤ |
18% | 10% | 12% | 24% | 30% | 15% | |
| Other ㅤ |
8% | 8% | 24% | 8% | 6% | 3% |
Resources as a barrier were selected by at least 50% of parents in each of the five TUG groups. This shows how resources are important for these families.
Barriers by TUG Status for Parents (N=289)
| Barriers and TUGs | Live in Rural Settings N = 63 |
Speak Language Other Than English N = 50 |
Racial/Ethnic Group N = 26 |
Child with Disabilities N = 90 |
Have Deaf or Hard of Hearing Child who is Lower Achieving Academically N = 72 |
Not a Member of TUGs N = 100 |
|
|---|---|---|---|---|---|---|---|
| Collaboration | 20% | 24% | 27% | 27% | 20% | 26% | |
| Curriculum, Instruction, and Assessment | 43% | 30% | 47% | 39% | 55% | 38% | |
| Early Hearing Detection and Intervention | 27% | 38% | 24% | 34% | 35% | 33% | |
| Expectations | 23% | 28% | 24% | 26% | 28% | 22% | |
| Family Involvement and Support |
47% | 58% | 43% | 50% | 42% | 46% | |
| Lack of Understanding |
43% | 48% | 50% | 48% | 45% | 42% | |
| Language and Communication |
56% | 54% | 43% | 60% | 56% | 7% | |
| Literacyㅤ | 29% | 22% | 35% | 27% | 35% | 28% | |
| Policy Legislation |
21% | 28% | 39% | 25% | 24% | 26% | |
| Qualified Direct Service Personnel | 58% | 42% | 50% | 49% | 60% | 46% | |
| Resourcesㅤ | 54% | 52% | 58% | 50% | 56% | 38% | |
| Social Concerns |
27% | 18% | 24% | 29% | 27% | 28% | |
| Students with Disabilities |
18% | 16% | 16% | 32% | 25% | 6% | |
| Technology | 18% | 10% | 12% | 24% | 30% | 15% | |
| Other | 8% | 8% | 24% | 8% | 6% | 3% |
Resources as a barrier were selected by at least 50% of parents in each of the five TUG groups. This shows how resources are important for these families.
Barriers by TUG Status for Parent-Professionals (N=165)
Frequency of Barrier and TUG Selections per Respondent
(Each respondent may belong to multiple TUG categories and report multiple barriers.)
| Barriers and TUGs | Live in Rural Settings N = 63 |
Speak Language Other Than English N = 50 |
Racial/Ethnic Group N = 26 |
Child with Disabilities N = 90 |
Have Deaf or Hard of Hearing Child who is Lower Achieving Academically N = 72 |
Not a Member of TUGs N = 100 |
|
|---|---|---|---|---|---|---|---|
| Collaboration ㅤ |
16% | 20% | 15% | 18% | 22% | 24% | |
| Curriculum, Instruction, and Assessment | 29% | 23% | 38% | 33% | 39% | 35% | |
| Early Hearing Detection and Intervention | 32% | 40% | 15% | 21% | 31% | 37% | |
| Expectations ㅤ |
26% | 33% | 31% | 31% | 25% | 29% | |
| Family Involvement and Support |
65% | 60% | 46% | 51% | 61% | 75% | |
| Lack of Understanding |
35% | 50% | 39% | 33% | 36% | 44% | |
| Language and Communication |
65% | 67% | 46% | 49% | 75% | 60% | |
| Literacy ㅤ |
32% | 40% | 46% | 31% | 44% | 41% | |
| Policy Legislation |
19% | 23% | 8% | 15% | 31% | 24% | |
| Qualified Direct Service Personnel | 65% | 30% | 39% | 36% | 31% | 35% | |
| Resources ㅤ |
19% | 23% | 8% | 31% | 28% | 18% | |
| Social Concerns |
16% | 33% | 39% | 28% | 17% | 25% | |
| Students with Disabilities |
10% | 17% | 23% | 21% | 14% | 18% | |
| Technology ㅤ |
3% | 0% | 0% | 3% | 6% | 6% | |
| Other ㅤ |
7% | 17% | 8% | 10% | 8% | 2% |
Family Involvement and Support, and Language and Communication were two barriers chosen by at least 45% of Parent-Professionals working with families in the five TUG groups. This shows how they see Family Involvement and Support and Language and Communication as being important for deaf and hard of hearing students to be able to achieve their fullest potential.
Barriers by TUG Status for Parent-Professionals (N=165)
| Barriers and TUGs | Live in Rural Settings N = 63 |
Speak Language Other Than English N = 50 |
Racial/Ethnic Group N = 26 |
Child with Disabilities N = 90 |
Have Deaf or Hard of Hearing Child who is Lower Achieving Academically N = 72 |
Not a Member of TUGs N = 100 |
|
|---|---|---|---|---|---|---|---|
| Collaboration | 16% | 20% | 15% | 18% | 22% | 24% | |
| Curriculum, Instruction, and Assessment | 29% | 23% | 38% | 33% | 39% | 35% | |
| Early Hearing Detection and Intervention | 32% | 40% | 15% | 21% | 31% | 37% | |
| Expectations | 26% | 33% | 31% | 31% | 25% | 29% | |
| Family Involvement and Support |
65% | 60% | 46% | 51% | 61% | 75% | |
| Lack of Understanding |
35% | 50% | 39% | 33% | 36% | 44% | |
| Language and Communication |
65% | 67% | 46% | 49% | 75% | 60% | |
| Literacyㅤ | 32% | 40% | 46% | 31% | 44% | 41% | |
| Policy Legislation |
19% | 23% | 8% | 15% | 31% | 24% | |
| Qualified Direct Service Personnel | 65% | 30% | 39% | 36% | 31% | 35% | |
| Resourcesㅤ | 19% | 23% | 8% | 31% | 28% | 18% | |
| Social Concerns |
16% | 33% | 39% | 28% | 17% | 25% | |
| Students with Disabilities |
10% | 17% | 23% | 21% | 14% | 18% | |
| Technology | 3% | 0% | 0% | 3% | 6% | 6% | |
| Other | 7% | 17% | 8% | 10% | 8% | 2% |
Family Involvement and Support, and Language and Communication were two barriers chosen by at least 45% of Parent-Professionals working with families in the five TUG groups. This shows how they see Family Involvement and Support and Language and Communication as being important for deaf and hard of hearing students to be able to achieve their fullest potential.
